
Which country truly leads Women’s ODI Cup history? We lean on verified tables and results and keep claims tied to the given data. We use only the stats you shared. No guesses or outside claims. Australia leads by titles and consistency. They own seven crowns through 2022 and missed the final only three times. That reliability defines dominance. Australia triumphed in 1978, 1982, and 1988, and they won again in 1997 and 2005. They added 2013 and 2022 to the list. That span shows sustained control.
The overview table lists 79 wins. It shows an 84.94 win percentage. That is elite among major teams. It reflects decades of high standards. Other teams rise at times. England peaks across multiple eras. New Zealand shines in 2000 and beyond. India’s challenges in 2005 and 2017.
Still, Australia remains the benchmark. Their depth keeps pressure on rivals, and their final habit compounds the edge. Their recent title keeps momentum strong. This makes the answer quite clear. Australia dominates by clear markers. Titles matter the most. Finals volume seals the claim.
Australia’s Grip: Titles, Wins, and Relentless Finals Presence
Australia wins across formats and cycles. They refresh cores without losing sharpness. They convert the group form into final control. That pattern repeats across eras.
They also avoid slumps between cycles, and they answer setbacks with quick rebounds. They protect the net run rate through discipline. Margins stay in their favor often. That creates less pressure in knockouts. They enter finals with belief. They hold nerves when moments turn tight. That calm follows long-term culture.
The takeaway is simple and strong. Dominance needs more than talent. It also needs systems and habits. Australia shows both repeatedly.
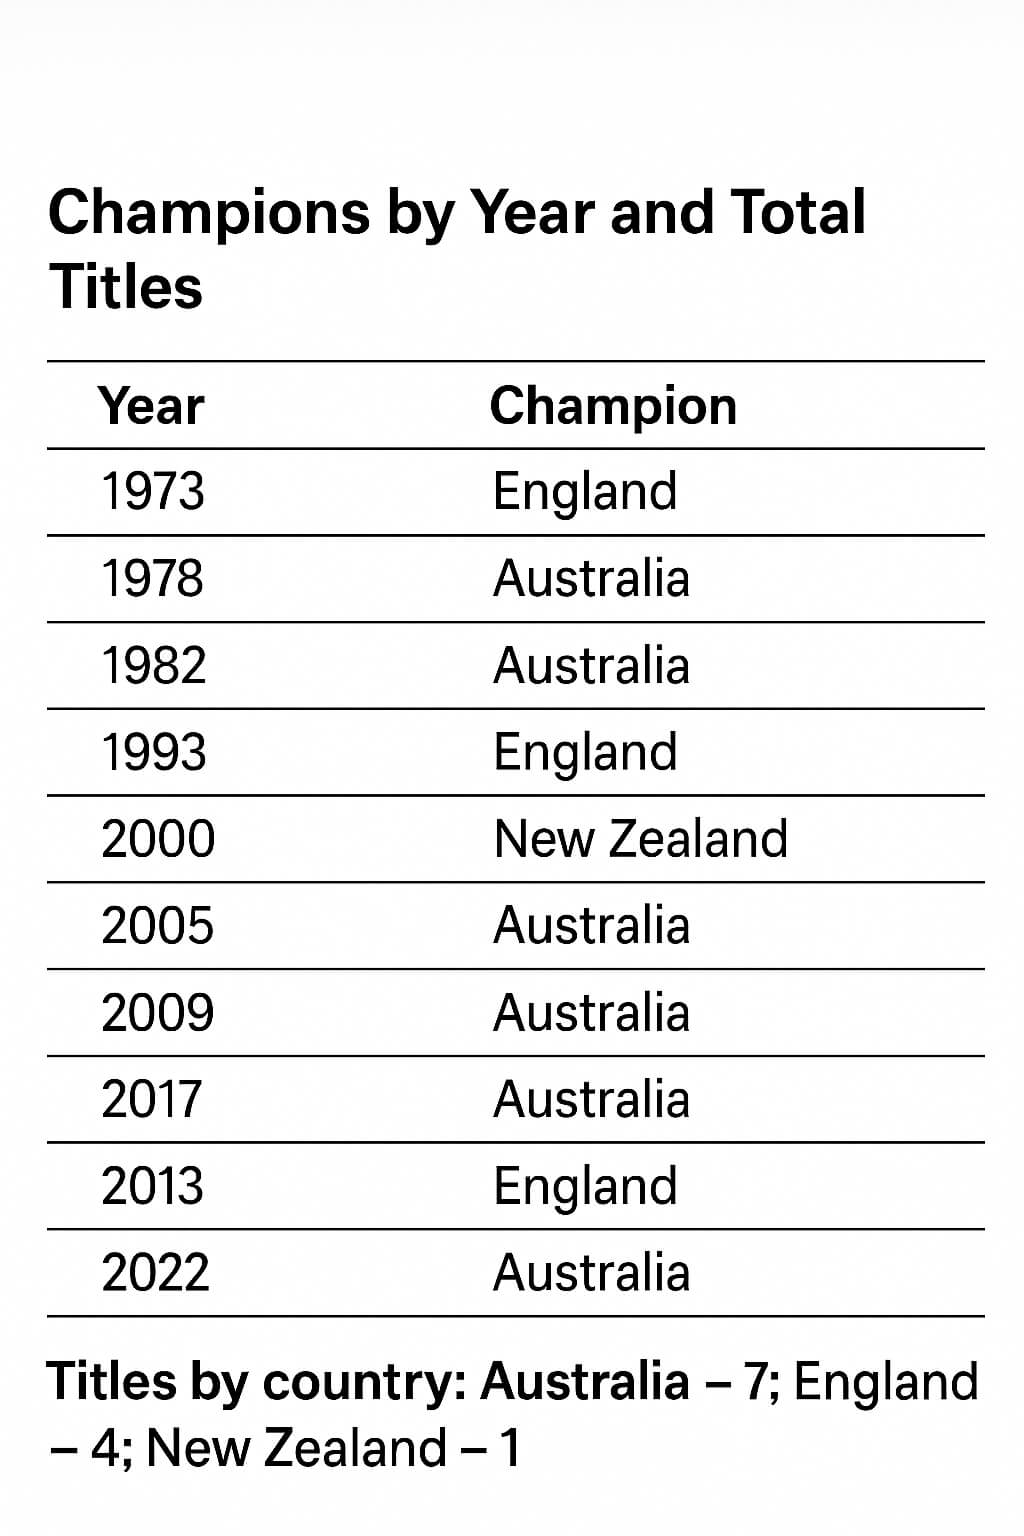
Champions by Year and Total Titles
| Year | Champion |
|---|---|
| 1973 | England |
| 1978 | Australia |
| 1982 | Australia |
| 1988 | Australia |
| 1993 | England |
| 1997 | Australia |
| 2000 | New Zealand |
| 2005 | Australia |
| 2009 | England |
| 2013 | Australia |
| 2017 | England |
| 2022 | Australia |
| 2022 | Australia |
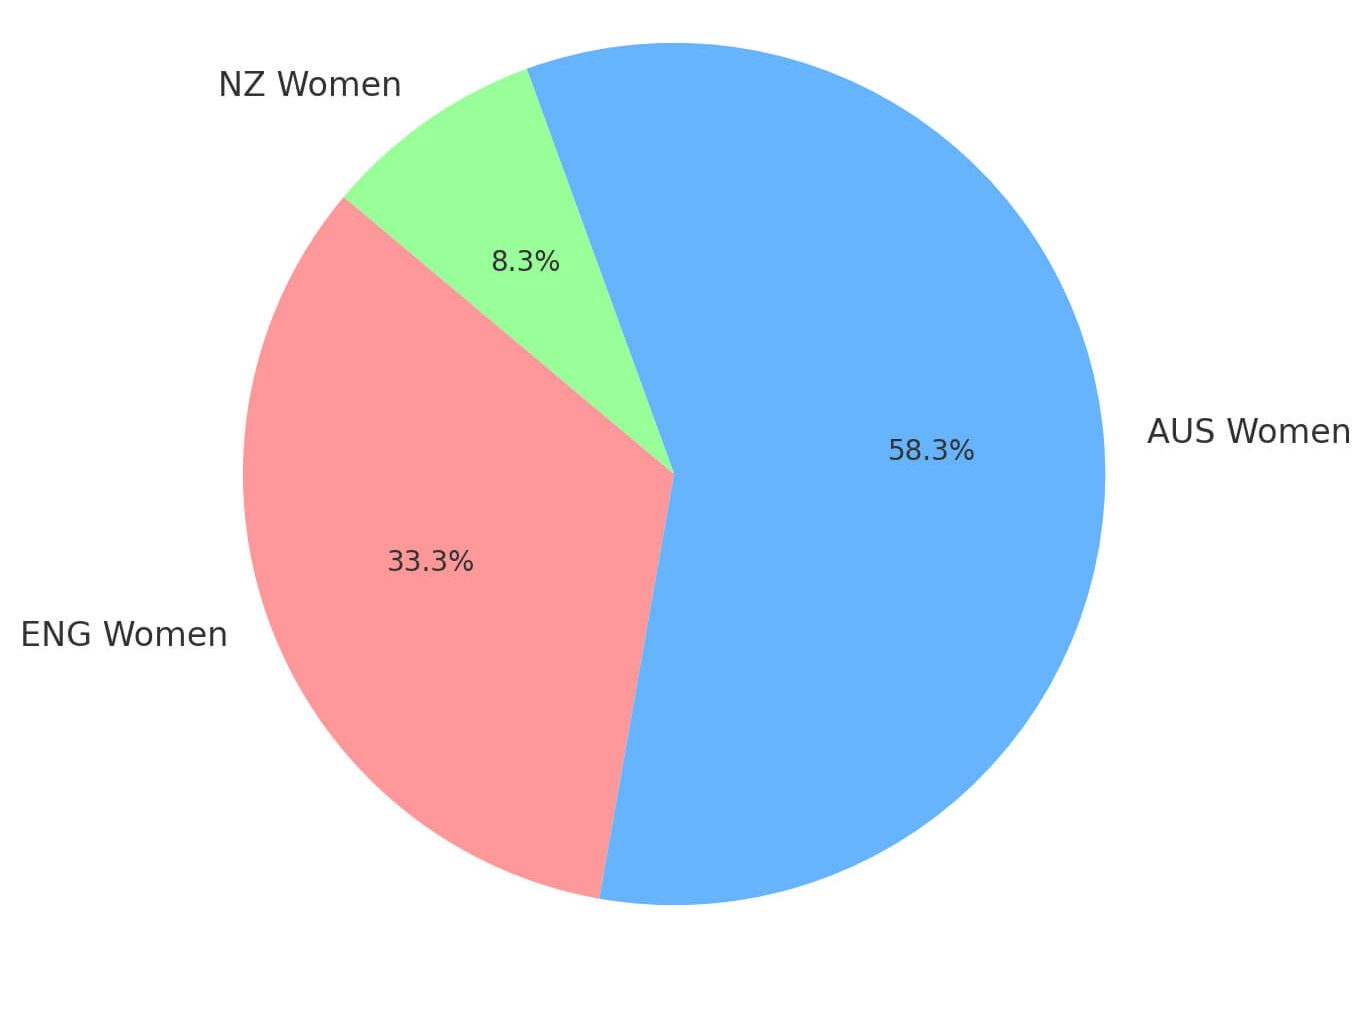
Titles by country: Australia – 7; England – 4; New Zealand – 1.
England and New Zealand: Consistent, Dangerous, and Often in the Mix
England features in every edition. They hold four titles. They finished as runners-up several times. Their finals count sits very high.
They won the First World Cup in 1973 and again in 1993. England lifted it again in 2009 and 2017. They finished second in 1978, 1982, and 1988.
New Zealand stays close to the top. They won the 2000 final. They finished second in 1993 and 1997. These teams bring big-match know-how. They sustain long periods of relevance and reload talent between cycles well. They keep pressure on the top seed.
Finals exposure matters in pressure. England shows comfort at Lord’s and beyond. New Zealand brings grit to Lincoln and Christchurch. Their records prove staying power.
Australia remains first in titles. England and New Zealand follow next. They define the chasing pack’s standard. They remain threats in future editions.
Finals Record Snapshot: Who Reaches the Last Day?
Final days demand control and calm. England has reached the finals many times. They win four and lose four. That balance still shows elite reach.
New Zealand turns up often as well. They win once and lose thrice. Those runs still shape tournament history. They push giants to the line. These two carry deep know-how, as they read pitches and moments well and manage chasing and setting totals.
Expect more finals from both sides. Experience compounds with each cycle. Young squads learn from past runs. That is a real edge.
Finals Tally by Team (Through 2022)
| Team | Titles | Runners-up | Finals Played |
|---|---|---|---|
| Australia | 7 | 2 | 9 |
| England | 4 | 4 | 8 |
| New Zealand | 1 | 3 | 4 |
| India | 0 | 2 | 2 |
| West Indies | 0 | 1 | 1 |
Note: 1973 and 1978 were decided by points tables.
India, South Africa, and West Indies: Near Peaks and Next Steps
India breaks through to two finals. They finished second in 2005 and 2017. That proves repeated contention. The next step is sealing a final.
South Africa reaches three semi-finals. They did that in 2000, 2017, and 2022. That shows a rising curve. Converting one semi would be huge.
The West Indies reach the 2013 final. They finish second to Australia and also make multiple knockouts. They remain a tricky matchup.
These teams challenge the leaders often. They disrupt with pace and spin. They punch above their seedings at times. Their ceiling feels within reach. India owns depth and fan support. South Africa fields tireless quicks. The West Indies bring x-factor hitting. Each can flip a bracket quickly.
One clinical knockout win can shift fate. Handling crunch overs is key. Fielding lapses must be trimmed. Those details decide trophies.
What Will Unlock That Final Step?
Small gains can change entire arcs. Improve power play control with the bat. Nail middle-over choke with ball. Secure death overs with clear roles.
Fielding standards must stay high. Drop rates swing tight games. Back-up plans help under pressure. Leaders should set calm tones. Data review can sharpen matchups. Use left-right splits wisely. Map boundary zones before innings. Keep plans short and crisp.
These teams are very close now. One clean run can rewrite history. The pieces exist already. Balance and belief will finish the job.
Records and Overview Stats: Proof of Long-Term Control
Records confirm who leads. Debbie Hockley tops Cup runs. Jhulan Goswami leads Cup wickets. Alyssa Healy owns the most runs in one edition.
Team marks seal the picture. Australia posted the highest team score. They also hold the most Cup wins at 79. Their win percentage remains excellent. The overview table shows clear gaps. Australia sits above England and New Zealand. India sits just below that band. Others chase the next tier.
These metrics align with titles. Consistency meets peak results. It’s not one hot run. It is a strength across many cycles. That is why dominance is clear. Titles crown the case strongly. Wins and win rate support it. Records round out the proof.
Reading The Numbers Without Bias
Numbers can mislead if isolated. We pair titles with win rates and check final counts with eras. We note hosts versus non-hosts. This keeps claims balanced and fair. It respects context and cycles, and also prevents hype from skewing truth. It values depth over narrative.
By that method, the leader stands firm. Australia’s edge is sustained. Chasers hold real quality. The gap is clear but not fixed. Future events may refresh ranks. More teams join from 2029. Depth will likely spread further. That can tighten the top.
Overview Snapshot by Team Winning The ODI Women’s World Cup
| Team | Apps | Best Result | Matches | Won | Lost | Tie | NR | Win% |
|---|---|---|---|---|---|---|---|---|
| Australia | 12 | Champions (7 times) | 93 | 79 | 11 | 1 | 2 | 84.94 |
| England | 12 | Champions (4 times) | 92 | 62 | 27 | 2 | 1 | 67.39 |
| New Zealand | 12 | Champions (1 time) | 87 | 54 | 30 | 2 | 1 | 62.06 |
| India | 10 | Runners-up (2005, 2017) | 70 | 37 | 31 | 1 | 1 | 52.85 |
| West Indies | 7 | Runners-up (2013) | 46 | 16 | 28 | 0 | 1 | 34.78 |
| South Africa | 7 | Semi-finals (2000, 2017, 22) | 46 | 20 | 24 | 0 | 2 | 43.47 |
Data reflects the provided 2022 endpoint.
Hosts and Defenders: Useful Trends, Not Guarantees
Hosts sometimes lift the trophy. England did so in 1973 and 1993. Australia did so in 1988. New Zealand did so in 2000.
But hosts also fall short often. South Africa finished seventh in 2005. Australia finished fourth in 2009. India finished seventh in 2013. New Zealand finished sixth in 2022.
Defending champions rarely repeat. Australia defended in 1982 and 1988. Many other holders fall short later. They exist in semis or lower tiers. So hosting helps, but not always. Defending adds pressure, not safety. Form and balance still matter most. Depth again becomes the decider.
Future hosts cannot rely on the venue. They must build flexible plans. They must peak at the right time. Small margins decide these events.
What to Expect in the Next Cycle?
The 2025 event is scheduled in Asia. Details remain to be confirmed. Expect familiar contenders near the top. Experience will likely guide key games.
From 2029, the field expands. Ten teams will contest the title. That should spread opportunities wider. It may reduce one-team control.
Coaching and data will matter more. Bench strength will be vital. Close finishes will grow more common. Fans should expect more thrillers. Even then, history still counts. Big match habits carry over. Calm teams win tight moments. The pattern rarely lies.
Conclusion
So, who dominates across the years? Australia sits clearly on top. Seven titles set the base. Finals volume strengthens the lead. England and New Zealand stand next. They own multiple finals and wins, as they prove class across many eras. They remain threats every cycle.
India, South Africa, and the West Indies push hard. They hit semi-finals and finals. They need one clean knockout run. That can change the story quickly.
Hosts and holders see mixed outcomes. Home turf helps, but not always. Defending adds weight, not certainty. Depth and calm still rule the day. Tables and records align on one point. Australia leads by clear markers. The rest fight in a tight pack. The next cycle could tighten gaps.


