The Duleep Trophy shows team performances over the years. West Zone played 108 matches, winning 56. North Zone has 106 matches with 51 wins. South Zone played 103 matches, winning 43. Central Zone has 97 matches with 26 wins. East Zone played 87 matches, winning 20. These stats highlight team strengths and histories.
In finals, West Zone won 19 times in 33 appearances, with a 50% win rate. North Zone has 18 wins in 26 finals, at 65.38%. South Zone won 13 times in 23 finals, at 52.17%. Central Zone has 6 wins in 16 finals, at 34.37%. East Zone won twice in 7 finals, at 28.57%.
Duleep Trophy Winners List
Wasim Jaffer leads the batting with 2545 runs for the West Zone. Raman Lamba scored the highest, 320, for the North Zone. Narendra Hirwani tops the bowling with 126 wickets for Central Zone. Debasis Mohanty had the best match figures, 14/91, for East Zone. These records show individual brilliance.
| Season | Winner | Runner-up | Result | Final Venue |
|---|---|---|---|---|
| 1961–62 | West Zone | South Zone | West Zone won by 10 wickets | Brabourne Stadium, Bombay |
| 1962–63 | West Zone | South Zone | West Zone won by an innings and 20 runs | Eden Gardens, Calcutta |
| 1963–64 | West Zone & South Zone (shared) | Draw | – | Feroz Shah Kotla, Delhi |
| 1964–65 | West Zone | Central Zone | West Zone won by an innings and 89 runs | Brabourne Stadium, Bombay |
| 1965–66 | South Zone | Central Zone | South Zone won by an innings and 20 runs | MA Chidambaram Stadium, Madras |
| 1966–67 | South Zone | West Zone | Draw, South Zone won by first innings lead | Brabourne Stadium, Bombay |
| 1967–68 | South Zone | West Zone | Draw, South Zone won by first innings lead | Brabourne Stadium, Bombay |
| 1968–69 | West Zone | South Zone | Draw, West Zone won by first innings lead | Lal Bahadur Shastri Stadium, Hyderabad |
| 1969–70 | West Zone | North Zone | West Zone won by an innings and 81 runs | Sardar Vallabhbhai Patel Stadium, Ahmedabad |
| 1970–71 | South Zone | East Zone | South Zone won by 10 wickets | Brabourne Stadium, Bombay |
| 1971–72 | Central Zone | West Zone | Central Zone won by 2 wickets | Central College Ground, Bangalore |
| 1972–73 | West Zone | Central Zone | West Zone won by an innings and 172 runs | Brabourne Stadium, Bombay |
| 1973–74 | North Zone | Central Zone | North Zone won by 76 runs | Brabourne Stadium, Bombay |
| 1974–75 | South Zone | West Zone | South Zone won by 9 wickets | Lal Bahadur Shastri Stadium, Hyderabad |
| 1975–76 | South Zone | North Zone | South Zone won by 37 runs | MA Chidambaram Stadium, Madras |
| 1976–77 | West Zone | North Zone | West Zone won by 9 wickets | Moti Bagh Stadium, Baroda |
| 1977–78 | West Zone | North Zone | Draw, West Zone won by first innings lead | Wankhede Stadium, Bombay |
| 1978–79 | North Zone | West Zone | Draw, North Zone won by first innings lead | Feroz Shah Kotla, Delhi |
| 1979–80 | North Zone | West Zone | North Zone won by 104 runs | Wankhede Stadium, Bombay |
| 1980–81 | West Zone | East Zone | Draw, West Zone won by first innings lead | Eden Gardens, Calcutta |
| 1981–82 | West Zone | East Zone | Draw, West Zone won by first innings lead | Brabourne Stadium, Bombay |
| 1982–83 | North Zone | South Zone | North Zone won by 8 wickets | Wankhede Stadium, Bombay |
| 1983–84 | North Zone | West Zone | Draw, North Zone won by first innings lead | Barabati Stadium, Cuttack |
| 1984–85 | South Zone | North Zone | South Zone won by 73 runs | Feroz Shah Kotla, Delhi |
| 1985–86 | West Zone | South Zone | West Zone won by 9 wickets | M. Chinnaswamy Stadium, Bangalore |
| 1986–87 | South Zone | West Zone | Draw, South Zone won by first innings lead | Wankhede Stadium, Bombay |
| 1987–88 | North Zone | West Zone | Draw, North Zone won by first innings lead | Jayanti Stadium, Bhilai |
| 1988–89 | North Zone & West Zone (shared) | Draw | – | Feroz Shah Kotla, Delhi |
| 1989–90 | South Zone | Central Zone | South Zone won by 322 runs | Gymkhana Ground, Secunderabad |
| 1990–91 | North Zone | West Zone | Draw, North Zone won by first innings lead | Keenan Stadium, Jamshedpur |
| 1991–92 | North Zone | West Zone | North Zone won by 236 runs | Sardar Vallabhbhai Patel Stadium, Valsad |
| 1992–93 | North Zone | Central Zone | Draw, North Zone won by first innings lead | Lal Bahadur Shastri Stadium, Hyderabad |
| 1993–94 | North Zone | West Zone | Round Robin | NA |
| 1994–95 | North Zone | South Zone | Round Robin | NA |
| 1995–96 | South Zone | Central Zone | Round Robin | NA |
| 1996–97 | Central Zone | South Zone | Central Zone won by 161 runs | Punjab Cricket Association Stadium, Mohali |
| 1997–98 | Central Zone & West Zone (shared) | Draw | – | MA Chidambaram Stadium, Chennai |
| 1998–99 | Central Zone | West Zone | Central Zone won by 122 runs | N2 Stadium, Aurangabad |
| 1999–2000 | North Zone | West Zone | Draw, North Zone won by first innings lead | Eden Gardens, Kolkata |
| 2000–01 | North Zone | Central Zone | Round Robin | NA |
| 2001–02 | West Zone | North Zone | Round Robin | NA |
| 2002–03 | Elite C | Plate Group B | Round Robin | NA |
| 2003–04 | North Zone | East Zone | North Zone won by 59 runs | Punjab Cricket Association Stadium, Mohali |
| 2004–05 | Central Zone | North Zone | Central Zone won by 9 wickets | Vidarbha Cricket Association Stadium, Nagpur |
| 2005–06 | West Zone | East Zone | West Zone won by 5 wickets | Sardar Patel Stadium, Ahmedabad |
| 2006–07 | North Zone | Sri Lanka A | North Zone won by 8 wickets | Eden Gardens, Kolkata |
| 2007–08 | North Zone | West Zone | North Zone won by 6 wickets | Wankhede Stadium, Mumbai |
| 2008–09 | West Zone | South Zone | West Zone won by 274 runs | MA Chidambaram Stadium, Chennai |
| 2009–10 | West Zone | South Zone | West Zone won by 3 wickets | Lal Bahadur Shastri Stadium, Hyderabad |
| 2010–11 | South Zone | North Zone | South Zone won by 7 wickets | ACA-VDCA Stadium, Visakhapatnam |
| 2011–12 | East Zone | Central Zone | East Zone won by an innings and 20 runs | Holkar Cricket Stadium, Indore |
| 2012–13 | East Zone | Central Zone | Draw, East Zone won by first innings lead | MA Chidambaram Stadium, Chennai |
| 2013–14 | North Zone & South Zone (shared) | Draw | – | Jawaharlal Nehru Stadium, Kochi |
| 2014–15 | Central Zone | South Zone | Central Zone won by 9 runs | Feroz Shah Kotla Ground, Delhi |
| 2016–17 | India Blue | India Red | India Blue won by 355 runs | Greater Noida Sports Complex Ground, Greater Noida |
| 2017–18 | India Red | India Blue | India Red won by 163 runs | Lucknow International Cricket Stadium, Lucknow |
| 2018–19 | India Blue | India Red | India Blue won by an innings and 187 runs | NPR College Ground, Dindigul |
| 2019–20 | India Red | India Green | India Red won by an innings and 38 runs | M. Chinnaswamy Stadium, Bangalore |
| 2022–23 | West Zone | South Zone | West Zone won by 294 runs | SNR College Cricket Ground, Coimbatore |
| 2023 | South Zone | West Zone | South Zone won by 75 runs | M. Chinnaswamy Stadium, Bangalore |
| 2024–25 | India A | India C | India A won by 132 runs | Rural Development Trust Stadium ‘B’, Anantapur |
| 2025–26 | – | – | – | BCCI Centre of Excellence Ground, Bengaluru |
Detailed Analysis of Duleep Trophy Statistics
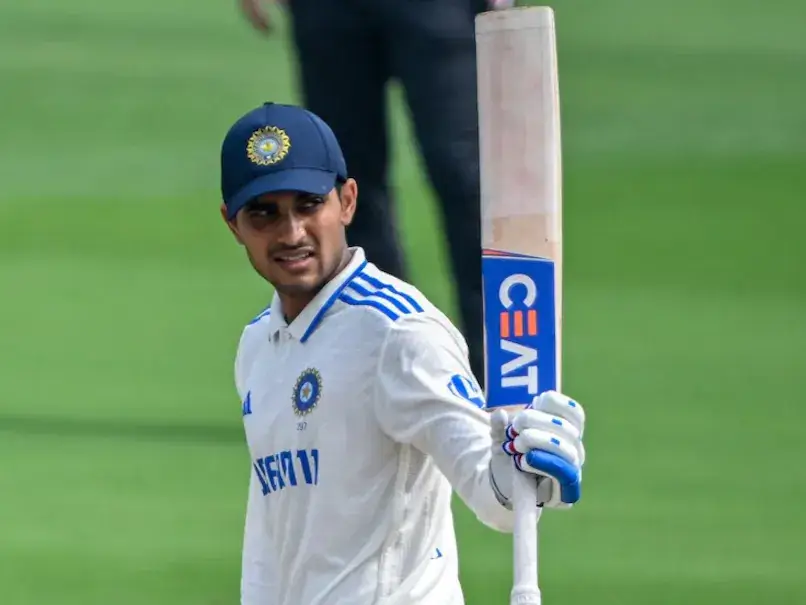
The Duleep Trophy, a prestigious domestic first-class cricket tournament in India, has a rich history of team and player performances, as evidenced by the detailed statistics provided. This analysis covers team appearances, finals performances, and individual records for batting, bowling, fielding, and team achievements, offering a comprehensive look at the tournament’s legacy, which we will also see in the 2025 season.
The data, sourced from ESPNcricinfo, reflects performances up to the last appearances noted, with West Zone and North Zone being the most prominent teams in recent years.
Team Appearances and Performance
The tournament has seen various teams compete, with zonal teams like West Zone, North Zone, South Zone, Central Zone, and East Zone dominating the match counts. West Zone leads with 108 matches, securing 56 wins, 33 losses, and 19 draws, with their last appearance in 2022.
International teams like England A (4 matches, 1 win, last in 2008) and Sri Lanka A (3 matches, 2 wins, last in 2006) also featured, adding diversity. North East Zone, a newer entrant, played 1 match in 2022, drawing it, indicating their emerging presence.
Below is the table for team appearances:
| Team | Matches | Wins | Losses | Draws | Last Appearance |
|---|---|---|---|---|---|
| West Zone | 108 | 56 | 33 | 19 | 2022 |
| North Zone | 106 | 51 | 31 | 24 | 2022 |
| South Zone | 103 | 43 | 38 | 22 | 2022 |
| Central Zone | 97 | 26 | 45 | 26 | 2022 |
| East Zone | 87 | 20 | 45 | 22 | 2022 |
| India Red | 12 | 4 | 2 | 6 | 2019 |
| India Blue | 11 | 2 | 1 | 8 | 2019 |
| India Green | 9 | 0 | 3 | 6 | 2019 |
| Elite Group A | 4 | 1 | 0 | 3 | 2003 |
| Elite Group B | 4 | 1 | 1 | 2 | 2003 |
| Elite Group C | 4 | 1 | 0 | 3 | 2003 |
| Plate Group A | 4 | 0 | 3 | 1 | 2003 |
| Plate Group B | 4 | 1 | 0 | 3 | 2003 |
| England A | 4 | 1 | 3 | 0 | 2008 |
| Sri Lanka A | 3 | 2 | 1 | 0 | 2006 |
| Bangladesh Board XI | 2 | 0 | 1 | 1 | 2005 |
| Zimbabwe Board XI | 2 | 0 | 2 | 0 | 2005 |
| North East Zone | 1 | 0 | 0 | 1 | 2022 |
This table highlights West Zone’s dominance in match count and wins, with North Zone close behind, reflecting their historical strength in the tournament.
Finals Appearances and Success Rates
In finals, the West Zone has been the most successful, with 19 wins in 33 appearances, achieving a 50% win rate, their last win in the 2009/10 season. North Zone has 18 wins in 26 finals, with a 65.38% win rate, last winning in 2013/14, indicating strong final performances. South Zone won 13 times in 23 finals, at 52.17%, also last in the 2013/14 Duleep Trophy.
Central Zone has 6 wins in 16 finals, at 34.37%, last in 2014/15, showing less consistency. East Zone has 2 wins in 7 finals, at 28.57%, last in 2012/13, suggesting challenges in closing out finals.
Non-zonal teams like India Blue and India Red each have 2 wins, with India Blue at 66.67% in 3 finals (last in 2018/19) and India Red at 50% in 4 finals (last in 2019/20). Elite C won once in their only final in 2002/03, while teams like Plate B, Sri Lanka A, and India Green have no wins in their single final appearances with domestic players.
Below is the table for finals appearances, with a note on shared trophies:
| Team | Wins | Appearances | Win % | Last Win |
|---|---|---|---|---|
| West Zone | 19 | 33 | 50.00 | 2009/10 |
| North Zone | 18 | 26 | 65.38 | 2013/14 |
| South Zone | 13 | 23 | 52.17 | 2013/14 |
| Central Zone | 6 | 16 | 34.37 | 2014/15 |
| East Zone | 2 | 7 | 28.57 | 2012/13 |
| India Blue | 2 | 3 | 66.67 | 2018/19 |
| India Red | 2 | 4 | 50.00 | 2019/20 |
| Elite C | 1 | 1 | 100.00 | 2002/03 |
| Plate B | 0 | 1 | 0.00 | – |
| Sri Lanka A | 0 | 1 | 0.00 | – |
| India Green | 0 | 1 | 0.00 | – |
Note: The Wins include the shared trophies, and the win percentage counts shared wins as half a win.
This table underscores West Zone’s historical dominance in finals, with North Zone showing the highest win percentage, reflecting their effectiveness in crucial matches.
Batting, Bowling, and Fielding Records
Individual records highlight the tournament’s stars. In batting, Wasim Jaffer leads with 2545 runs for West Zone and Elite B from 1997–2013, with 8 hundreds and 13 fifties, averaging 55.32, his highest score being 173*. Raman Lamba holds the highest score of 320 for North Zone against West Zone in 1987/88 and scored 659 runs in a tournament that year, with a highest average of 86.25. Anshuman Gaekwad hit 9 hundreds for West Zone, while Jaffer also has 21 fifties.
Moreover, the highest partnership is 409 by VVS Laxman and Rahul Dravid for South Zone’s 3rd wicket against West Zone. Multiple players, including Ashok Dinda, EAS Prasanna, Ashok Mankad, and Narendra Hirwani, share the record for most ducks with 8 each.
In bowling, Narendra Hirwani dominated with 126 wickets for Central Zone and Plate B from 1987–2004, averaging 34.12, with 8 five-wicket hauls and 2 ten-wicket hauls, his best being 7/129 in an innings and 12/200 in a match. Debasis Mohanty holds the best bowling figures, with 10/46 in an innings and 14/91 in a match, both against South Zone.
Moreover, Hirwani also took 34 wickets in a series in 2002/03. Sairaj Bahutule took 112 wickets for West Zone and Elite B, while B. S. Chandrasekhar took 99 for South Zone, both with notable averages and economy rates.
Fielding records show Parthiv Patel with 88 dismissals as a wicket-keeper (68 catches, 20 stumpings) for West Zone, Elite C, and India Green, while Sameer Dighe had 10 dismissals in a match (6 catches, 4 stumpings) for West Zone. Wasim Jaffer also leads fielders with 41 catches for the West Zone and Elite B.
Below are tables for key records

Team records include North Zone’s highest score of 868 against West Zone in 1987/88, and both North Zone and East Zone sharing the lowest score of 48, against South Zone in 1961 and 1969, respectively. Individual milestones include Mohinder Amarnath playing 31 matches for North Zone from 1969–1988, Hanumant Singh and Srinivasaraghavan Venkataraghavan each captaining 15 matches for Central Zone and South Zone, respectively, and Suresh Shastri umpiring 13 matches from 1993–2013.
Batting Records
| Record | Player/Team | Value |
|---|---|---|
| Most runs | Wasim Jaffer (West Zone, Elite B) | 2545 |
| Highest score | Raman Lamba (North Zone) | 320 vs West Zone (1987/88) |
| Most runs in a tournament | Raman Lamba (North Zone) | 659 (1987/88) |
| Highest average | Raman Lamba (North Zone) | 86.25 |
| Most ducks | Ashok Dinda, EAS Prasanna, Ashok Mankad, Narendra Hirwani | 8 each |
| Most hundreds | Anshuman Gaekwad (West Zone) | 9 |
| Most fifties | Wasim Jaffer (West Zone, Elite B) | 21 |
| Highest partnership | VVS Laxman & Rahul Dravid (South Zone) | 409 vs West Zone |
Bowling Records
| Record | Player/Team | Value |
|---|---|---|
| Most wickets | Narendra Hirwani (Central Zone, Plate B) | 126 |
| Best bowling in an innings | Debasis Mohanty (East Zone) | 10/46 vs South Zone |
| Best bowling in a match | Debasis Mohanty (East Zone) | 14/91 vs South Zone |
| Most wickets in a series | Narendra Hirwani (Plate Group B) | 34 (2002/03) |
| Most 5-wicket hauls | Narendra Hirwani (Central Zone, Plate B) | 8 |
| Most 10-wicket hauls | Narendra Hirwani (Central Zone, Plate B) | 2 |
Fielding Records
| Record | Player/Team | Value |
|---|---|---|
| Most dismissals (WK) | Parthiv Patel (West Zone, Elite C, India Green) | 88 (68c, 20st) |
| Most dismissals in a match (WK) | Sameer Dighe (West Zone) | 10 (6c, 4st) |
| Most catches (fielder) | Wasim Jaffer (West Zone, Elite B) | 41 |
Team Records
| Record | Team | Value |
|---|---|---|
| Highest score | North Zone | 868 vs West Zone (1987/88) |
| Lowest score | North Zone, East Zone | 48 |
Individual Records
| Record | Player/Team | Value |
|---|---|---|
| Most matches | Mohinder Amarnath (North Zone) | 31 (1969–1988) |
| Most matches as captain | Hanumant Singh (Central Zone), Srinivasaraghavan Venkataraghavan (South Zone) | 15 each |
| Most matches as umpire | Suresh Shastri | 13 (1993–2013) |
Top 5 Run Scorers
| Player | Team(s) | Span | Mat | Inns | Runs | Ave | HS | 100 | 50 |
|---|---|---|---|---|---|---|---|---|---|
| Wasim Jaffer | Elite B, West Zone | 1997–2013 | 30 | 54 | 2545 | 55.32 | 173* | 8 | 13 |
| Vikram Rathour | North Zone | 1993–2002 | 25 | 45 | 2265 | 51.47 | 249 | 6 | 11 |
| Anshuman Gaekwad | West Zone | 1974–1987 | 26 | 42 | 2004 | 52.73 | 216 | 4 | 2 |
| Ajay Sharma | North Zone | 1984–1997 | 26 | 37 | 1961 | 57.67 | 202 | 7 | 9 |
| Akash Chopra | Central Zone, North Zone, Elite A | 1997–2011 | 24 | 43 | 1918 | 53.27 | 205* | 6 | 8 |
Top 3 Wicket Takers
| Player | Team(s) | Span | Mat | Inns | Wkts | Ave | Econ | SR | BBI | BBM | 5 | 10 |
|---|---|---|---|---|---|---|---|---|---|---|---|---|
| Narendra Hirwani | Central Zone, Plate B | 1987–2004 | 29 | 45 | 126 | 34.12 | 2.99 | 68.4 | 7/129 | 12/200 | 8 | 2 |
| Sairaj Bahutule | West Zone, Elite B | 1993–2006 | 30 | 48 | 112 | 26.76 | 2.84 | 56.4 | 6/41 | 9/114 | 4 | 0 |
| B. S. Chandrasekhar | South Zone | 1963–1979 | 24 | 41 | 99 | 24.30 | 2.81 | 51.7 | 8/80 | 10/183 | 7 | 1 |
Although North Zone follows closely with 106 matches, 51 wins, 31 losses, and 24 draws. Also, it was last seen in 2022. South Zone played 103 matches, winning 43, losing 38, and drawing 22, while Central Zone has 97 matches with 26 wins, 45 losses, and 26 draws. East Zone, with 87 matches, has 20 wins, 45 losses, and 22 draws, last appearing in 2022. Other teams like India Red, India Blue, and India Green, part of non-zonal formats, have fewer matches, with India Red playing 12 matches and winning 4, last seen in 2019.
